
Backona AI vs Grafana: Comprehensive Comparison for Data-Driven Marketing
In the rapidly evolving world of data intelligence, choosing the right platform often comes down to a direct comparison—grafana vs other leading solutions. This comprehensive 2025 comparison between Backona AI and Grafana Labs examines their core capabilities, AI intelligence, automation features, scalability, integrations, and ideal use cases. Both platforms harness AI to deliver insights but cater to distinct needs: Backona AI shines in predictive analytics and marketing automation, while Grafana Labs is the preferred solution for observability, system telemetry, and infrastructure monitoring.
Summary
This guide highlights the key differences between Backona AI and Grafana Labs, focusing on their approaches to data visualization, data exploration, and automation. Backona AI specializes in predictive insights and cross-departmental workflow automation for business intelligence. In contrast, Grafana Labs is a free and open source platform, making it highly accessible and driven by community development, and excels at real-time monitoring, visualizing log data, and analyzing system performance metrics tailored for IT and DevOps teams.
Quick Answer:
Backona AI is best suited for businesses seeking predictive analytics, automation, and unified business intelligence. Grafana Labs is ideal for IT, DevOps, and engineering teams focused on infrastructure monitoring, log analysis, and system observability.
Introduction
As we advance into 2025, the fusion of AI with analytics and automation is revolutionizing how organizations make data-driven decisions. Both Backona AI and Grafana Labs leverage AI capabilities, but their missions and target audiences differ substantially.
Backona AI empowers marketing, sales, and finance teams by delivering predictive insights and automating reporting workflows. It unifies data from multiple data sources—including CRM, ERP, and advertising platforms—enabling businesses to visualize data and analyze business metrics effortlessly, all without requiring technical expertise.
Conversely, Grafana Labs is renowned for its open-source data visualization tools that excel at visualizing time series data, log data, and system metrics. It is widely adopted by DevOps, IT operations, and Site Reliability Engineering (SRE) teams to monitor infrastructure, analyze logs, and troubleshoot system performance through interactive dashboards. Grafana also benefits from strong community support, with active user forums and communities that help users troubleshoot issues, share best practices, and enhance their experience.
By the end of this article, you will understand why Backona AI is the smarter choice for predictive, cross-functional business intelligence, while Grafana Labs remains the gold standard for infrastructure monitoring and observability.
Introduction to Data Visualization
Data visualization is a powerful technique for transforming complex datasets into clear, graphical representations that make it easier to understand and analyze information. By visualizing data, organizations can quickly identify trends, patterns, and outliers that might otherwise go unnoticed in raw data tables. This is especially important when dealing with large volumes of log data or monitoring key business and system metrics.
Effective data visualization is at the heart of modern data analysis and metrics monitoring. It enables teams to make informed decisions by presenting data in intuitive formats such as charts, graphs, and dashboards. Tools like Kibana and Grafana have become industry standards for data visualization, particularly when it comes to visualizing log data and tracking system performance. These platforms help users move beyond static reports, allowing for dynamic exploration and real-time insights that drive better outcomes.
Whether you’re analyzing marketing performance or monitoring IT infrastructure, the ability to visualize data is essential for uncovering actionable insights and optimizing operations.
What is Backona AI?
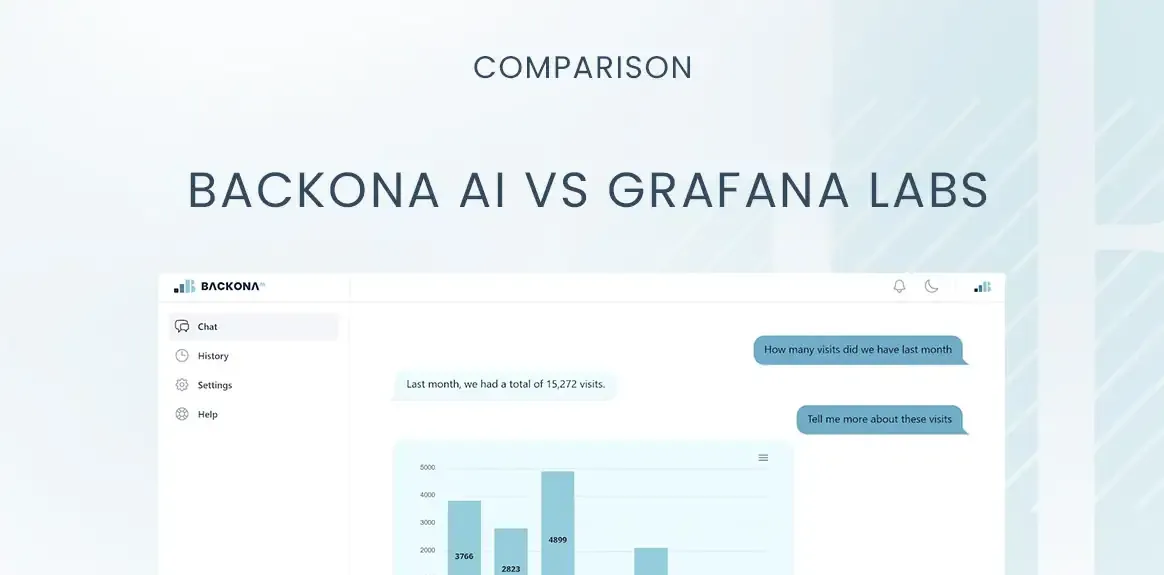
Backona AI is an AI-powered marketing analytics and business intelligence platform designed to unify data stored across various business operations into a single, actionable intelligence layer. It connects to 250+ data sources, including Google Analytics, Google Ads, Salesforce, and finance tools, allowing teams to ask questions in natural language and receive instant, data-driven answers.
Key Features of Backona AI:
Backona AI’s standout capabilities include predictive analytics, which utilizes machine learning algorithms to forecast campaign and business performance. This feature helps teams anticipate trends and optimize strategies before challenges arise. Additionally, Backona offers AI-driven workflow automation that streamlines reporting and anomaly detection across departments, significantly reducing the need for manual analysis.
Its no-code interface empowers users without technical skills to create custom reports and dashboards, making it easy to visualize business metrics such as revenue, conversion rates, and campaign effectiveness. Backona AI’s scalable cloud-native architecture supports enterprise-level deployments with adaptive compliance and security measures, ensuring data protection and regulatory adherence.
By providing a unified data view, Backona AI combines marketing, sales, finance, and operations data, enabling comprehensive business insights that promote better decision-making.
Ideal users: Enterprises, marketing managers, finance teams, and SMBs seeking to leverage predictive insights and automate business intelligence.
What is Grafana Labs Data Visualization?
Grafana Labs is the company behind Grafana, the world’s leading open-source data visualization and observability platform. Grafana excels at integrating multiple data sources such as Prometheus, Loki, Elasticsearch, and AWS CloudWatch to provide a unified view of system metrics, logs, and traces. The variety of data sources Grafana supports includes Prometheus, InfluxDB, Elasticsearch, Graphite, PostgreSQL, MySQL, and cloud services like AWS CloudWatch, and it can integrate these sources simultaneously to enhance dashboard flexibility. Grafana can be easily configured using an .ini configuration file, simplifying setup compared to other tools.
Grafana supports a wide range of visualization types including line graphs, pie charts, heat maps, geo maps, and data tables, enabling teams to create interactive dashboards that visualize data from diverse environments. Grafana supports graph visualizations, allowing users to create and customize graph panels as a key feature in dashboard creation. This makes it an excellent tool for visualizing log data and analyzing time series data collected from servers and applications.
Key Features of Grafana Labs:
Grafana’s open-source ecosystem offers flexibility and extensibility through numerous plugins and integrations, making it a favorite among DevOps and IT teams. Grafana allows configuration options to be overridden using environment variables, providing a flexible and straightforward method for configuring deployments in various scenarios. It serves as a comprehensive monitoring tool for infrastructure, capable of visualizing time series data and log data collected from servers, applications, and cloud environments.
The platform includes the AI-powered Grafana Assistant, a large language model (LLM) agent that facilitates natural language queries for data exploration and anomaly detection, enhancing the user experience in analyzing complex datasets.
Security is a priority with role-based access control (RBAC) and Lightweight Directory Access Protocol (LDAP) integration, ensuring secure and granular control over dashboard access. Grafana supports multiple data sources, including SQL databases, Elasticsearch, Prometheus, and Loki, allowing teams to pull data from various systems for comprehensive monitoring.
Grafana also enables users to create personalized alerts based on metrics and logs, helping teams proactively manage system health.
Ideal users: DevOps engineers, IT operations teams, SREs, and developers requiring advanced infrastructure monitoring and log analytics. Learn more about the team behind this platform on our About Us page.
Feature Comparison Table
| Feature | Backona AI | Grafana Labs |
|---|---|---|
| Primary Focus | Predictive analytics & automation | Observability & monitoring |
| AI Intelligence | Predictive forecasting, anomaly detection, automation | Grafana Assistant (natural language observability) |
| Ease of Use | No-code dashboards | Technical configuration required |
| Integrations | 250+ (CRM, ERP, Ads, Finance) | 100s (AWS, Prometheus, Loki, Mimir, etc.) |
| Automation | Cross-department workflow automation | Automated anomaly detection & alerts |
| Predictive Analytics | Yes — AI-driven forecasting | Partial (root cause analysis, adaptive telemetry) |
| Scalability | Elastic, cloud-native for any business | Enterprise-grade observability at scale |
| Reporting | Real-time AI dashboards for business data | Visual dashboards for infrastructure metrics |
| Compliance | GDPR, ISO 27001, adaptive compliance | SOC2, GDPR, enterprise-grade security |
| External SQL Server | Not supported for authentication/data source | Supported for authentication/data source |
| Support | 24/7 AI + human support | Community + enterprise support tiers |
Pricing Comparison (2025)
| Plan | Backona AI | Grafana Labs |
|---|---|---|
| Free / Entry | $99/month (Growth Starter) | Grafana Cloud Free (10k metrics, 50GB logs) |
| Professional | $499/month (Team Plan) | Pro Tier from $19/month + usage |
| Enterprise | Custom, ROI-based | $25,000/year and up |
| Verdict: Grafana offers a cost-effective solution for developers and IT teams focusing on observability, while Backona AI’s pricing is structured around delivering business ROI and automation value. |
Pros & Cons
| Backona AI | Grafana Labs | |
|---|---|---|
| ✅ Pros | Predictive automation, multi-department scope, no-code | Open-source, extensible, powerful for observability |
| ⚪ Cons | Not designed for infrastructure metrics | Technical learning curve, limited business analytics, but its alerting engine is capable of managing data unavailability, ensuring reliable notifications even when data is missing or connections fail. |
| Backona AI is designed with business users in mind, offering ease of use and automation across departments. Grafana, meanwhile, is a powerful visualization tool for monitoring infrastructure but requires technical expertise to configure and operate effectively. |
Onboarding & Ease of Use
Backona AI features an AI-guided onboarding process that connects key data sources and automatically builds predictive dashboards, making it accessible for non-technical users. Users can ask questions in natural language and receive actionable insights without needing to understand complex query languages or configuration files.
In contrast, Grafana requires manual setup of data sources, dashboards, and alerting rules, often managed by DevOps or engineering teams. The installation and configuration steps for Grafana may vary depending on the operating system used, and the platform supports a query editor for data querying using various languages such as PromQL or Elasticsearch Query DSL, which can be challenging for non-technical users.
Result: Backona AI is ideal for business teams seeking quick, no-code access to data insights, while Grafana excels as a technical observability tool for infrastructure monitoring.
Integrations and Ecosystem
- Backona AI integrates with over 250 data sources, including CRM systems like Salesforce, marketing platforms such as Google Ads, finance tools like NetSuite, and e-commerce platforms including Stripe. This extensive connectivity enables unified reporting and automation across business functions.
- Grafana Labs supports hundreds of data sources focused on infrastructure and telemetry monitoring, including AWS CloudWatch, Prometheus for metrics monitoring, Loki for log management, Mimir for metrics storage, and traditional SQL databases. Grafana can be deployed and operated across various operating systems, enhancing its flexibility for different IT environments. It also integrates with the ELK stack (Elasticsearch, Logstash, Kibana) for advanced log analysis.
Key difference: Grafana dominates in visualizing log data, analyzing time series data, and monitoring infrastructure performance, whereas Backona leads in business performance intelligence and predictive analytics.
Elastic Stack Integration
The Elastic Stack—commonly known as the ELK Stack—has become a cornerstone for organizations seeking robust log management and data analysis solutions. Comprising Elasticsearch, Logstash, and Kibana, the Elastic Stack streamlines the process of collecting, processing, and visualizing log data from a variety of sources.
Kibana serves as the visualization layer of the Elastic Stack, providing a user-friendly interface for exploring and visualizing log data stored in Elasticsearch. With Kibana, users can create interactive dashboards that display data in multiple formats, including line charts, bar charts, heat maps, and more. This makes it easy to perform ad hoc analysis, monitor security analytics, and gain insights from log data collected across different systems.
The Elastic Stack is widely adopted for log analysis and log management, enabling organizations to centralize data stored in Elasticsearch and visualize it for operational intelligence. Its flexibility supports a range of use cases, from security analytics to business intelligence, making it a go-to solution for teams that need to analyze and visualize log data efficiently.
Reporting & Insights on Log Data
Backona AI provides real-time AI-powered dashboards that deliver predictive insights into marketing campaigns, revenue forecasts, and operational performance. Its platform supports custom chart generation including pie charts, line charts, and data tables, enabling users to visualize business metrics clearly and take automated actions based on insights. Both platforms enable users to analyze data through dashboards and visualization tools for deeper insights.
Grafana Labs offers rich visualization tools for infrastructure metrics, logs, and traces. Users can create dashboards by assembling a variety of data visualizations—such as heat maps, geo maps, and single metric panels—from multiple data sources, allowing for interactive and customizable reporting. Grafana enables users to use data queries to retrieve, filter, and analyze information for dashboards and alerts, supporting ad hoc analysis and exploring log data through its query editor. This makes it a powerful tool for log analytics, analyzing logs in real time, and facilitating comprehensive data exploration.
Compliance & Security
Both platforms prioritize enterprise-grade security and compliance:
- Backona AI complies with GDPR and ISO 27001 standards, employing AES-256 data encryption and adaptive compliance monitoring. It supports role-based access control (RBAC) to control access to sensitive business data.
- Grafana Labs adheres to SOC2 and GDPR regulations, offering secure data tenancy and built-in user control. It integrates with Lightweight Directory Access Protocol (LDAP) for authentication and supports granular access control to dashboards and data sources.
Verdict: Grafana excels in securing infrastructure telemetry data, while Backona AI automates compliance across business data environments.
Scalability & Performance
Backona AI is designed to scale across multiple departments, automating thousands of insights daily and handling large volumes of marketing and business data stored across diverse platforms. It is optimized for business-focused data types, such as campaign performance, customer behavior, and marketing analytics.
Grafana Labs is engineered to scale for billions of telemetry data points collected from distributed infrastructure environments. It is optimized for time-series data types, making it ideal for monitoring infrastructure metrics and logs at enterprise scale with high-performance data storage and querying capabilities, including support for data encryption and optimized data querying.
Result: Backona AI scales with business growth and cross-functional intelligence needs, while Grafana scales to meet the demands of complex infrastructure monitoring.
Use Cases
Backona AI
- Predictive marketing and revenue analytics: Forecast campaign outcomes and optimize budgets.
- Cross-department workflow automation: Streamline reporting and anomaly detection across sales, finance, and marketing.
- AI-driven anomaly and ROI detection: Identify performance issues and opportunities automatically.
Grafana Labs
- Observability and monitoring for IT infrastructure: Visualize system CPU, memory, network metrics, and application logs.
- Anomaly detection in system logs and telemetry: Detect unusual patterns in log data collected from servers.
- Root cause analysis using AI-assisted dashboards: Leverage Grafana Assistant to troubleshoot incidents quickly.
Case Study Comparison
- A global enterprise using Backona AI improved forecast accuracy by 41% and reduced manual analysis time by 78% through automation and predictive insights.
- An SRE team employing Grafana Labs reduced incident response time by 65% by utilizing Grafana Assistant and adaptive telemetry monitoring.
Grafana and Kibana Comparison
Grafana and Kibana are two of the most popular open-source data visualization tools, each excelling in different areas of data analysis and monitoring. Grafana is renowned for its versatility, supporting multiple data sources such as Prometheus, InfluxDB, and Elasticsearch. This flexibility allows users to visualize data from a wide range of environments, making Grafana a top choice for metrics monitoring and infrastructure observability. Its extensive library of visualization types—including graphs, tables, and heat maps—enables teams to create rich, interactive dashboards tailored to their needs.
Kibana, on the other hand, is purpose-built for log analysis and is deeply integrated with the Elastic Stack. It offers advanced search and query capabilities, making it ideal for exploring and visualizing log data stored in Elasticsearch. Kibana’s strength lies in its ability to provide detailed insights into log data, supporting use cases such as security analytics, log management, and ad hoc analysis.
When comparing Grafana and Kibana, the key differences come down to data source flexibility and specialization. Grafana supports multiple data sources and is well-suited for metrics monitoring and open source data visualization across diverse systems. Kibana is optimized for log analysis within the Elastic Stack, offering powerful tools for visualizing log data and performing complex queries. Ultimately, the choice between Grafana and Kibana depends on your specific requirements—whether you need broad support for various data sources or deep integration with log data and the Elastic Stack.
Future of Analytics and Observability
As AI continues to transform analytics and monitoring, the future lies in intelligent automation that bridges insight and action. While Grafana Labs will maintain its leadership in infrastructure observability and log analytics, Backona AI’s predictive automation will increasingly empower business teams to make data-driven decisions faster and more effectively.
Conclusion — Which Is Better?
Grafana Labs is the premier choice for DevOps, SREs, and IT operations teams focused on system observability, log management, and infrastructure monitoring.
Backona AI stands out for businesses seeking predictive analytics, automation, and unified cross-department intelligence.
Verdict: For organizations prioritizing data-driven business performance and ease of use, Backona AI is the more strategic, future-ready platform.
FAQ
1. What is Backona AI?
An AI-powered analytics platform delivering predictive insights and automation across marketing, sales, finance, and operations.
2. What is Grafana Labs?
The company behind Grafana, an open-source platform for visualizing metrics, logs, and traces to monitor infrastructure and application performance.
3. Is Backona AI better than Grafana Labs?
Backona AI excels in business analytics and predictive automation, while Grafana is stronger for technical observability and infrastructure monitoring.
4. Who should use each platform?
Backona AI suits business and marketing teams; Grafana fits DevOps, IT, and SRE teams.
5. What are alternatives to Backona AI?
Platforms like Databricks, Dataiku, and Datorama offer comparable business intelligence and analytics capabilities.
6. Can I use both Kibana and Grafana together?
Yes, using both Kibana and Grafana can be beneficial. Both Kibana and Grafana are powerful visualization tools, but they serve different use cases. By using both together, you can achieve comprehensive monitoring and data analysis—Kibana excels at exploring and visualizing log data, while Grafana is ideal for metrics and infrastructure dashboards. This combination is especially useful in complex infrastructures where you need a complete view of your data.
Additional Resources
Data Sources: This article references official Grafana Labs documentation, pricing details, and Backona AI product data as of October 2025.